Mach–Zehnder Interferometer (MZI)
Posted Updated 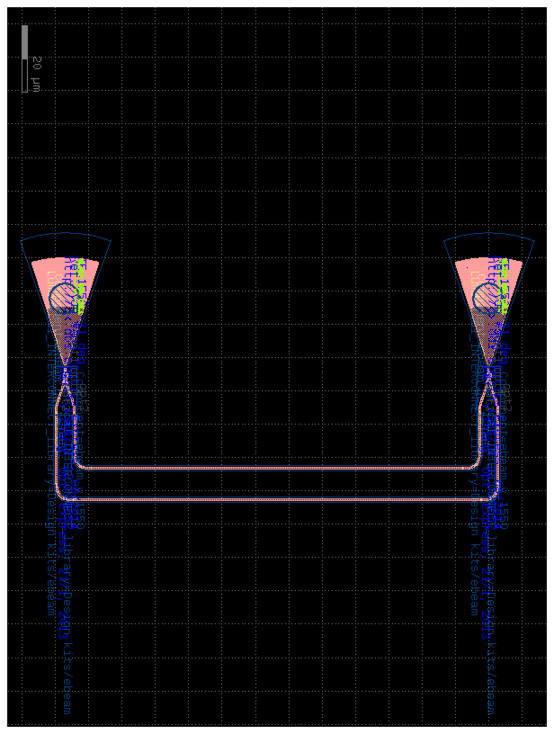
MZI with grating couplers in GDSFactory
By Ram Prakash Shanmugam | Ram Prakash S
2 min read
Circuit simulation of MZI
Using SAX, GDSFactory with PDK SiEPIC
Source Code
1
2
3
4
5
6
7
8
9
10
11
12
13
14
15
16
# Import the necassry packages
import gplugins.modes as gm
import numpy as np
import matplotlib.pyplot as plt
import matplotlib.patches as patches
import meep as mp
import gdsfactory as gf
from ubcpdk import PDK, cells

PDK.activate()
import sax
from jax import config
config.update("jax_enable_x64", True)
import jax.numpy as jnp
from simphony.libraries import siepic
1
2
3
4
Using MPI version 4.1, 1 processes
[32m2025-10-28 02:20:57.788[0m | [1mINFO [0m | [36mgplugins.gmeep[0m:[36m<module>[0m:[36m39[0m - [1mMeep '1.31.0' installed at ['/home/ramprakash/anaconda3/envs/si_photo/lib/python3.13/site-packages/meep'][0m
Loading components from the PDK and making geometry with gdsfactory
Source Code
1
2
3
4
5
6
7
8
9
10
11
12
13
14
15
16
17
18
19
20
21
22
23
24
25
26
27
28
29
30
31
32
33
34
35
36
37
38
39
40
41
42
43
44
45
46
47
48
49

y_branch=cells.ebeam_y_1550()
bend = cells.bend_euler(radius=5,p=0.75)
gc = cells.ebeam_gc_te1550()

my_device = gf.Component()
y_in = my_device.add_ref(y_branch)
y_out = my_device.add_ref(y_branch)
gc_in = my_device.add_ref(gc)
gc_out = my_device.add_ref(gc)

short_waveguide=my_device.add_ref(cells.straight(10.8186))
long_waveguide=my_device.add_ref(cells.straight(20.299))
waveguide=my_device.add_ref(cells.straight(111.5))
short_waveguide2=my_device.add_ref(cells.straight(10.8186))
long_waveguide2=my_device.add_ref(cells.straight(20.299))
waveguide2=my_device.add_ref(cells.straight(122.5))

bend1 = my_device.add_ref(bend)
bend2 = my_device.add_ref(bend)
bend3 = my_device.add_ref(bend)
bend4 = my_device.add_ref(bend)

gc_in.connect('o1', y_in.ports['o1'])
short_waveguide.connect('o1', y_in.ports['o3'])
bend1.connect('o2',short_waveguide.ports['o2'])
waveguide.connect('o1',bend1.ports['o1'])
bend2.connect('o2',waveguide.ports['o2'])
short_waveguide2.connect('o2',bend2.ports['o1'])
y_out.connect('o2',short_waveguide2.ports['o1'])

long_waveguide.connect('o1', y_in.ports['o2'])
bend3.connect('o2',long_waveguide.ports['o2'])
waveguide2.connect('o1',bend3.ports['o1'])
bend4.connect('o2',waveguide2.ports['o2'])
long_waveguide2.connect('o2',bend4.ports['o1'])
y_out.connect('o3',long_waveguide2.ports['o1'])
gc_out.connect('o1', y_out.ports['o1'])

# my_device.add_port(name="o1", port=y_in.ports["o1"])
# my_device.add_port(name="o2", port=y_out.ports["o1"])

# my_device_gc=gf.components.add_grating_couplers(component=my_device)
my_device.plot()
plt.show()


# my_device_gc.name="Sample_MZI"
# my_device_gc.write_gds("Sample_MZI.gds")
Source Code
1
2
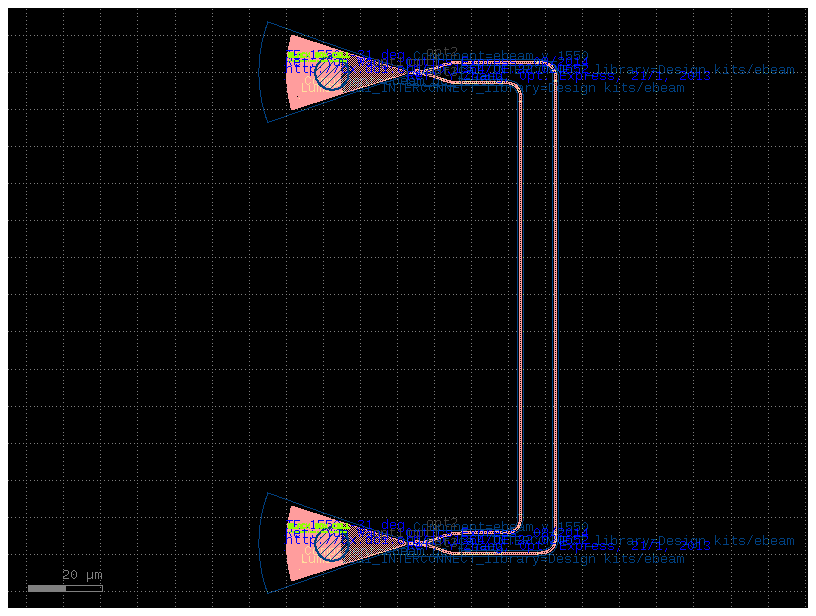
scene = my_device.to_3d()
scene.show()
Source Code
1
2
3
print(sax.get_ports(siepic.y_branch()))
print(sax.get_ports(siepic.waveguide()))
print(sax.get_ports(siepic.grating_coupler()))
1
2
3
('port_1', 'port_2', 'port_3')
('o0', 'o1')
('o0', 'o1')
Source Code
1
2
3
4
5
6
7
8
9
10
11
12
13
14
15
16
17
18
19
20
21
22
23
24
25
26
27
28
29
netlist={"instances": {
            "gc_in": "gc",
            "splitter": "ybranch",
            "long_wg": "waveguide",
            "short_wg": "waveguide",
            "combiner": "ybranch",
            "gc_out": "gc",
        },
        "connections": {
            "gc_in,o0": "splitter,port_1",
            "splitter,port_2": "long_wg,o0",
            "splitter,port_3": "short_wg,o0",
            "long_wg,o1": "combiner,port_2",
            "short_wg,o1": "combiner,port_3",
            "combiner,port_1": "gc_out,o0",
        },
        "ports": {
            "in": "gc_in,o1",
            "out": "gc_out,o1",
        }
        }
mzi, info = sax.circuit(
    netlist=netlist,
    models={
        "ybranch": siepic.y_branch,
        "waveguide": siepic.waveguide,
        "gc": siepic.grating_coupler,
    }
)
Source Code
1
sax.get_settings(mzi)
1
2
3
4
5
6
7
8
9
10
11
12
13
14
15
16
{'gc_in': {'wl': 1.55, 'pol': 'te', 'thickness': 220.0, 'dwidth': 0},
 'splitter': {'wl': 1.55, 'pol': 'te', 'thickness': 220.0, 'width': 500.0},
 'long_wg': {'wl': 1.55,
  'pol': 'te',
  'length': 0.0,
  'width': 500.0,
  'height': 220.0,
  'loss': 0.0},
 'short_wg': {'wl': 1.55,
  'pol': 'te',
  'length': 0.0,
  'width': 500.0,
  'height': 220.0,
  'loss': 0.0},
 'combiner': {'wl': 1.55, 'pol': 'te', 'thickness': 220.0, 'width': 500.0},
 'gc_out': {'wl': 1.55, 'pol': 'te', 'thickness': 220.0, 'dwidth': 0}}
Source Code
1
2
3
4
5
6
7
8
9
10
11
12
13
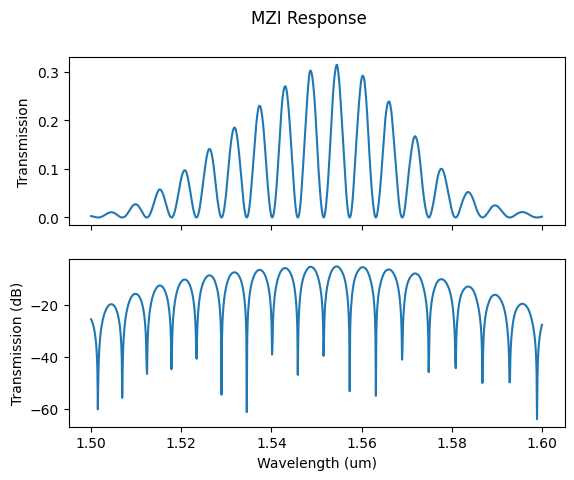
wl = jnp.linspace(1.5, 1.6, 1000)
S = mzi(wl=wl, long_wg={"length": 150.0}, short_wg={"length": 50.0})
mag = jnp.abs(S["out", "in"])**2
fig, axs = plt.subplots(2, 1, sharex=True)
axs[0].plot(wl, mag)
axs[0].set_ylabel("Transmission")
axs[1].plot(wl, 10*jnp.log10(mag))
axs[1].set_ylabel("Transmission (dB)")
axs[1].set_xlabel("Wavelength (um)")
plt.suptitle("MZI Response")
plt.show()
This post is licensed under CC BY 4.0 by the author.